TABLE OF CONTENTS
2. Split report to parts by selected attribute
10. Save your report for further use
Introduction
Reporting is one of the integral parts of CELUS enabling users to analyze their data from many different perspectives. This article will help you create reports that match your needs (and have some fun with your data).
Step 1 is to click on "Create report" in the left side menu:

The "Create report" page offers numerous interactive elements. Let's explore their significance and the possibilities they offer.
1. Report Type

The Report Type option enables you to specify the source from which data will be extracted for your report. It serves as the foundation for the information displayed in your report. Please note that if the chosen report is unavailable on the platform or hasn't been harvested before the report creation, your data may be incomplete.
Tip: Choose only one report type at a time to ensure accuracy. Selecting multiple reports in this step can result in data overlap and inaccuracies.
You can read more about individual report types here.
1a. Pre-defined subviews
Starting with CELUS version 6.1.0, you can select a pre-defined subview report (such as TR_J1, TR_J2, etc.) at this step, and apply its filters automatically. Choose the filter that fits your needs and click on it:

CELUS now applied the filters accordingly. You can now change any attribute to your liking, or move to step 8.
2. Split report to parts by selected attribute

Splitting the report is useful for large reports, e.g. consortial reports, or reports with lots of data from different platforms. You can split your report by different attributes (platforms, organization, data type, year of publishing, etc.) Splitting works similarly to individual sheets in one Excel file, except the header will always be the same. After running a report with splitting enabled, you will see the list of available options to be viewed (in this example, we are splitting the report by platform):

Tip: In your exported Excel file, you can see the different parts of your splitted report in individual sheets.
3. Rows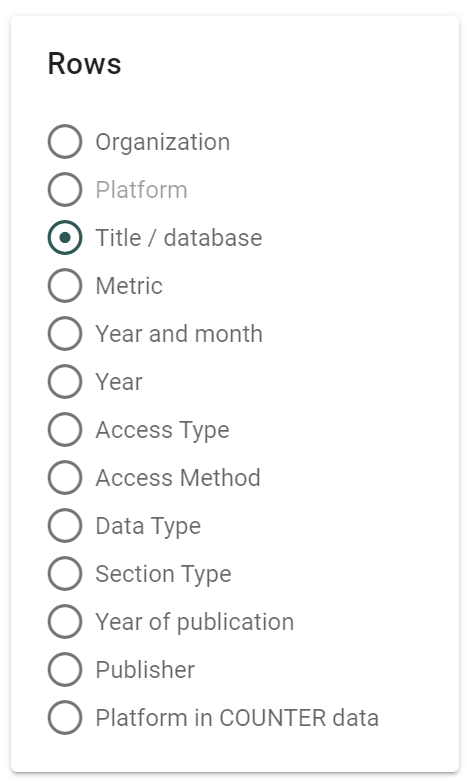
Unlike in COUNTER reports, you can only choose one attribute to be listed in the rows of your report in CELUS. In most cases, this is going to be a Title/database. This is how your report will look like with Titles/database chosen as Rows:

Tip: CELUS is always going to show the Tags, ISSN, eISSN and ISBN columns next to the names of the titles. To get rid of these columns, export the report into Excel and hide or delete them.
4. Columns

You can select any number of values from the list to display in columns according to your preference. Another possibility is to create a trend analysis report, that works slightly differently. For more information about trend analysis reports, please read this article.
5. Filters

Just like selecting columns, you have the freedom to choose as many filters as you need (don't be shy. You know you want to). Once you check the boxes here, the filtering settings corresponding to your selections will appear below. You can see that in our example, we have chosen to filter Year and Data type. In the filter settings below, we can now see our options for Data Type and Year. For our example report, we are going to choose Data Type "Journal" and the year 2023.


You can choose multiple options in Data Type, and other filters where it makes sense.

Tip: You can either choose any number of full years to be displayed by setting up a "Year" filter as seen above, or you can set up e.g. a fiscal year by selecting the "Year and month" filter.
6. Tags

You can group titles or platforms in reports by Tags (read more about Tags in CELUS). Would you like to compare the various topics your students are reading? Limit returned tags by tag class Scopus #2 and see your titles grouped by topic in your report:

Tip: For this type of "group by topic" analysis, choose "no splitting" in step 2 to see all your data in one place.
7. Data coverage

Next to our Filter Settings, you'll find a Data coverage widget. This widget is interactive and shows the percentage of available data (successfully harvested or uploaded in CELUS) based on the report settings. For instance, if it displays 65% as in our example, it means our data isn't complete for an accurate report. Clicking on the widget reveals details about missing data and provides an opportunity to obtain them before running the report. You can read more about data coverage in CELUS in this article.
8. RUN, REPORT, RUN!

This is the moment of glory, you can now click the "RUN REPORT" button. This will prompt an overview of the report you just created:

In our report overview, we can see a column called "Row total". This value does not make any sense in our example, because it combines all our metrics. We can get rid of it by disabling the "Show totals" toggle next to the famous "RUN REPORT" button:

Similarly, we can choose whether we want to see the rows with zero usage or not.
Click on the "RUN REPORT" button again to see the changes in action.
Tip: Click on "Expand to full screen" under the report overview to see your data better.
9. Chart view
By clicking on the chart icon in the upper right corner of the report overview, you can toggle between a table view and a chart view:

You can decide which metrics values you want to see in the chart by clicking and unclicking their respective boxes. The icons in the upper right corner also enable you to download the chart as an image and stack the data.
10. Save your report for further use
Unsurprisingly, you can save your report by clicking on the "Save report" button:

The following dialog will be prompted, where you need to name the report (choose a descriptive name that will help you reuse the report correctly) and choose your desired visibility (in accordance with your user rights in CELUS):

Tip: Are you making the same report over and over every fiscal year? Save the report and reuse it with different time period.
You can access your saved reports (and those of your organization) by clicking on "Reports" in the left-side menu:

11. Export the report
To let your report free from CELUS, you don't need to take your socks off. Just click on the "Export" button:

and choose the desired format:

In a couple of seconds, minutes, hours, or days, depending on the size of your report, a DOWNLOAD button will appear next to the Export button. You know what to do!

If the exporting takes too long, don't worry. You can leave CELUS to do its job and even close the window. The export will continue in the background and you can later (maximum for 7 days) find it in the "Exports" section of the left-side menu:

Congratulations! You have now mastered the reporting module of CELUS and created the long-awaited report. Go get some coffee, you deserve it!
Was this article helpful?
That’s Great!
Thank you for your feedback
Sorry! We couldn't be helpful
Thank you for your feedback
Feedback sent
We appreciate your effort and will try to fix the article